By Mike Darlow*
Most of those who run businesses sensibly focus on operating the business rather than on its bookkeeping and the production of its financial reports, tax returns and similar.
If a business keeps its accounts properly and up to date, they provide a fount of financial knowledge which enable those who understand them to make better operating decisions and foresee and thus avoid or minimise problems before they arise.
Business record keeping has existed for at least 10,000 years, but what we know as double entry accounting (including book keeping) was invented in about 1300 AD in Italy. It is a wonderfully elegant concept, but the conventional purely text based teaching and explanations of accounting hide this elegance and thus make accounting far more difficult to understand than it should be.
I am a professional woodturner. My wife took a short term contract in the island of Jersey. As Jersey’s main industry is finance, I undertook a book keeping course by correspondence in order to get a job there. I found the course notes poor (it took me three weeks to understand the terms debit and credit), and invented balance charts to explain bookkeeping to myself. After returning to Australia, and having
already written and self published six woodturning books, I researched and wrote Know Accounting Graphically (KAG). The book uses balance charts to explain the basics of book keeping, accounting and tax in Australia. The remainder of this article uses balance charts to introduces balance charts and demonstrates how they can help you better understand and manage your business.

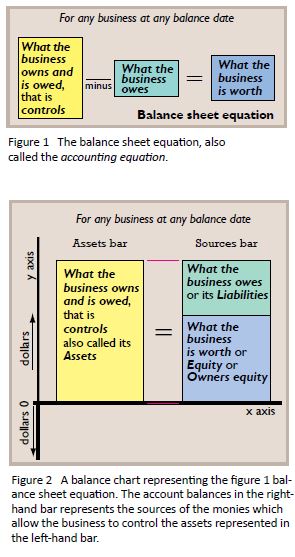
Figure 2 shows figure 1 as a balance chart. The height of each coloured box in both figures represents an account balance. An account is, as in literature, a story. It’s the story or record of amounts of money becoming associated with and becoming disassociated from the centre of interest for which the account is named. The total of the amounts which have become associated with an account less the total of the amounts which have become disassociated from the same account up to midnight on the specified date (the balance date) is that account’s balance.
If a business kept only the three accounts pictured in figures 1 and 2, the resulting historical record would not easily yield the detailed information valuable required for the business to fulfil its reporting obligations. For a company, those three account balances are therefore first separated into the constituent account balances shown in figure 3.
To measure changes in performance and other changes within a business, the lives of businesses
are split into periods. Because many businesses are seasonal, the most important length is 12 months long. For convenience, most businesses use a period (called an annual accounting period) that coincides with the year over which income tax is assessed – 1 July to 30 June.
The income and expenses accounts in figure 3 are closed (their balances are brought to zero by being transferred into the retained profits account) as at the end of each annual reporting period, and thus start the next annual reporting period with zero balances.

The activities of a business can be represented as a continuing series of transactions, where a transaction is ‘an episode that results in a financial change in a business’. Figure 4 shows a balance chart representing a credit purchase of stock. Its two constituent transactions are the buyer taking possession of the stock and incurring a debt, and the buyer later paying that debt.
Each box represents a posting, and its postings are the amounts that become associated with and disassociated from accounts referred to earlier.
Balance charts can represent one or multiple transactions, balance sheets, profit or loss statements, other financial statements, comparisons (see figure 5), and budgets. Balance charts therefore enable you to visualise financial situations and events, solve problems graphically, and better communicate financial information.
*Mike Darlow is the author of Know Accounting Graphically. For more information, or to buy the book, visit www.knowaccountinggraphically.com or phone (02) 4883 4455.


